
In 2009, the Rural School and Community Trust published a report that spotlighted impoverished rural school districts in America. They created a national map of those districts using data from the National Center for Education Statistics and the data base for funding under Title I of the Elementary and Secondary Education Act (NCLB).
According to their methodology, rural districts are those located in a municipality of no greater than 25,000 people and are more than 10 mi. away from an urban center. The districts highlighted on the map below are those that, of the rural districts initially identified, fell into the top 10% in terms of rate of students in poverty.
According to their methodology, rural districts are those located in a municipality of no greater than 25,000 people and are more than 10 mi. away from an urban center. The districts highlighted on the map below are those that, of the rural districts initially identified, fell into the top 10% in terms of rate of students in poverty.
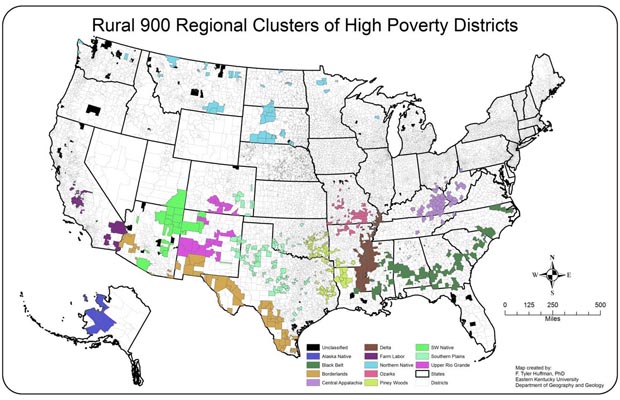
The overall poverty rate in these districts is 37%, while 70% of their students receive free and reduced meals.
The data brought about some powerful high-level conclusions. Per the study, “There is no racial majority among these rural and small town students — 28% are African American, 23% Hispanic, 8% Native American, and 41% white...These districts serve almost 1.3 million students and have poverty rates higher than many high-poverty urban districts.”
In addition to Southern regions commonly understood as impoverished - the Mississippi Delta, the Black Belt, and Appalachia - the data set also presented two new regions to consider, which they termed Piney Woods and Ozarks. These sub-regions deserve to be studied in greater detail. I'll make an effort to do so in the coming weeks.
Tomorrow, though, we’ll take a closer look at what happens to the national data when you take out towns of more than 2,500.
Until then,
Travis
 RSS Feed
